MEAN MEDIAN MODE CALCULATOR
| Sample Calculation |
|
| Smallest | 9 |
| Largest | 20 |
| Sum | 145 |
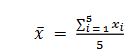
| Mean(Avarage) | 14.5 |
| Median | 15.5 |
| Count | 10 |
| Standard Deviation | 3.2939338184001 |
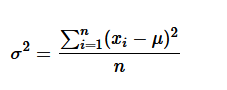
| Variance | 10.85 |
| Range | 11 |
| Mode | 16 appears 3 times |
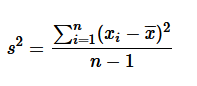
| Sample Standard Deviation | 3.4721111093333 |
| Geometric Mean | 14.099771727092 |
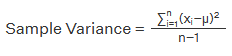
| Sample Variance | 12.055555555556 |
| Sorted Array | 9, 10, 12, 13, 15, 16, 16, 16,18, 20 |
In statistics, the Mode is the value that has most appearance in a set of data values.For example , a set of data 10, 12, 11, 10, 15, 20, 19, 21, 11, 9, 10 , the mode is "10 occures 3 times".Mode can be multiple , if multiple values has highest occurance , follow the below set of data2,3,4,4,4,4,5,5,6,7,7,8,9,9,9,9,10,11,12,12.The mode is 4 occures 4 times, 9 occures 4 times.
Standard Deviations are of two types , standard deviation and sample standard deviation. During calculating the population standard deviation, we divide by n, the number of data values. For calculating the sample standard deviation, we divide by n -1.